



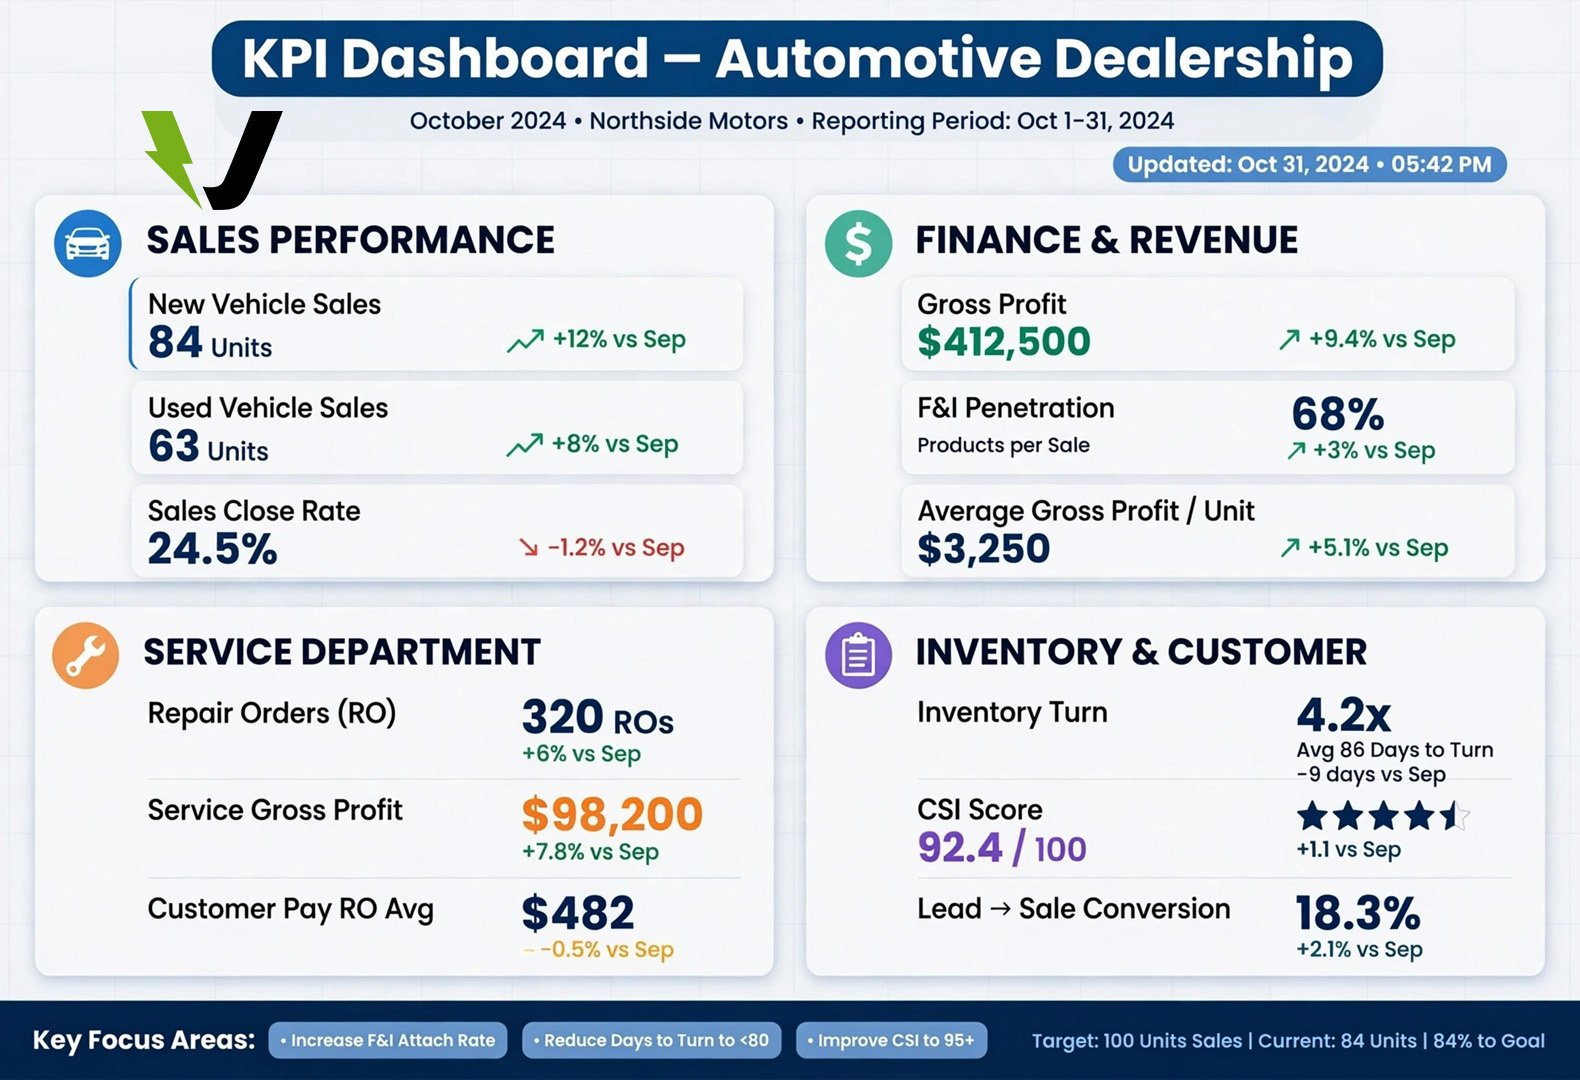
A KPI for automotive dealership operations is a measurable number that shows whether sales, inventory, finance, service, marketing, and customer-retention processes are performing as expected.
The most useful dealership KPIs do more than report revenue. They help managers find slow inventory, weak lead conversion, falling gross profit, service-capacity problems, and customer-experience issues before they become expensive.
Table of Contents
- What Is a KPI for an Automotive Dealership?
- Sales and Lead-Management KPIs
- Inventory and Used-Car KPIs
- F&I and Profitability KPIs
- Service and Fixed Operations KPIs
- Customer Experience and Digital KPIs
- FAQs
- Conclusion
Quick Information
| KPI | What It Measures | Simple Formula |
|---|---|---|
| Closing rate | Sales effectiveness | Sales ÷ qualified opportunities × 100 |
| Gross profit per vehicle | Profit per retail unit | Vehicle gross ÷ units sold |
| Inventory turn | How quickly stock sells | Annualized sales ÷ average inventory |
| Days in stock | Vehicle aging | Current date − stock-in date |
| F&I PVR | Finance profit per vehicle | F&I gross ÷ retail units |
| Service absorption | Overhead covered by fixed ops | Fixed ops gross ÷ adjusted overhead |
| Average repair order | Service revenue per RO | Service sales ÷ repair orders |
| Technician productivity | Workshop output | Produced hours ÷ available hours |
| Lead response time | Sales responsiveness | Lead time to first contact |
| Customer retention | Repeat business | Returning customers ÷ eligible customers |
Targets should be compared with similar dealerships rather than treated as universal standards. NCM Associates emphasizes that benchmarking works best when stores compare themselves with similar operations and track trends consistently.
What Is a KPI for an Automotive Dealership?
A KPI for automotive dealership management turns daily activity into numbers that can be tracked over time. For example, simply knowing that a dealership sold 100 vehicles is less useful than also knowing its gross profit per vehicle, closing rate, inventory age, and advertising cost.
Dealerships should normally separate metrics by department: new vehicles, used vehicles, F&I, service, parts, marketing, and overall financial performance. NCM Associates specifically highlights departmental gross contribution, expense ratios, fixed-operations absorption, gross profit per vehicle, and inventory aging as important benchmarking areas.
Internal linking opportunity: Link this section to articles about automotive dealership software, dealer CRM systems, or automotive SaaS analytics.
Sales and Lead-Management KPIs
Sales managers should know not only how many vehicles were sold but how efficiently the dealership turned enquiries into completed transactions.
Important sales KPIs include:
- New vehicles sold
- Used vehicles sold
- Closing rate
- Test-drive rate
- Gross profit per vehicle
- Units sold per salesperson
- Lead response time
- Appointment-setting rate
- Appointment show rate
- Quote-to-sale conversion
Lead response time
Lead response time measures how long it takes the dealership to make the first meaningful attempt to contact an online prospect.
This KPI is highly controllable. A dealership may not control interest rates or competitor pricing, but management can control whether a customer enquiry waits five minutes or five hours before receiving a response.
Automotive dealership analytics systems commonly treat response time and lead aging as core sales-effectiveness metrics because delayed leads can become less likely to progress through the pipeline.
Inventory and Used-Car KPIs
Inventory is one of a dealership’s largest uses of capital. A vehicle sitting unsold for months can create financing expense, depreciation risk, discounting pressure, and lost opportunities to stock faster-selling models.
Two of the most useful measurements are days in stock and inventory turn.
Inventory turn
Inventory turn shows how many times the dealership replaces its average inventory during a year.
A simple formula is:
Annualized units sold ÷ average inventory
NCM Associates recommends tracking both inventory turn and aging because high-performing dealers treat inventory as a changing asset rather than something that can simply remain on the lot indefinitely.
Aging buckets
Instead of looking only at average age, managers can divide stock into groups such as:
- 0–30 days
- 31–60 days
- 61–90 days
- 91–120 days
- More than 120 days
This makes problem vehicles easier to identify.
A unit that reaches the dealership’s aging threshold may require repricing, better merchandising, wholesale disposal, or a review of why it was acquired.
F&I and Profitability KPIs
The Finance and Insurance department can contribute significantly to the profitability of every retail transaction.
One important metric is F&I gross profit per vehicle retailed, often shortened to F&I PVR or PRU.
Useful F&I KPIs
Dealerships can track:
- F&I gross per retail unit
- Finance penetration
- Vehicle service contract penetration
- GAP product penetration
- Product cancellations
- Chargebacks
- Contracts in transit
- Average deal funding time
High F&I PVR does not automatically mean the department is healthy. Managers should also monitor cancellations, customer complaints, compliance, and product penetration so profitability is not being created by unsustainable selling practices.
Gross profit per vehicle
NCM Associates identifies gross profit per vehicle as a core dealership KPI but warns that it should be viewed in context. A store can show strong profit on each car while losing market share or selling too few units.
The stronger dashboard therefore combines volume + margin + expenses instead of maximizing one number in isolation.
Service and Fixed Operations KPIs
Service and parts are especially important because they can produce recurring revenue after the original vehicle sale.
NADA’s 2024 midyear dealership data reported more than 133 million repair orders and over $76 billion in service-and-parts sales during the first half of that year across U.S. franchised light-vehicle dealerships. Average service and parts sales were about $4.5 million per dealership for the period.
Fixed absorption rate
One of the best-known dealership measurements is fixed operations absorption.
It asks:
How much of dealership overhead can service, parts, and related fixed operations cover?
A commonly used formula is:
Service + parts + body-shop gross profit ÷ adjusted dealership overhead × 100
A higher absorption rate makes a dealership less dependent on vehicle-sales margins for survival.
Other important fixed-ops KPIs
Track:
- Customer-pay repair orders
- Warranty repair orders
- Average repair-order value
- Labor hours per RO
- Effective labor rate
- Technician productivity
- Technician efficiency
- Parts gross margin
- Appointment show rate
- Service retention
- Fixed absorption
NADA data also showed average service-and-parts sales of approximately $450 per customer repair order during the first half of 2024, illustrating why repair-order value deserves regular monitoring.
Customer Experience and Digital KPIs
A dealership can be profitable this month while quietly losing future customers.
That is why customer-experience metrics should sit beside financial KPIs.
Useful measurements include:
- Customer Satisfaction Index (CSI)
- Net Promoter Score where used
- Online review rating
- Repeat-purchase rate
- Service retention
- Appointment show rate
- Complaint-resolution time
- Website lead conversion
- Digital retail completion rate
How to build a practical KPI dashboard
A dealer principal does not need 100 numbers on the main dashboard.
A useful weekly scorecard might include:
| Area | KPI |
| Sales | Units + closing rate |
| Profit | Total gross PVR |
| Inventory | Average age + aged units |
| F&I | Gross PVR |
| Marketing | Leads + cost per sale |
| Service | ROs + average RO |
| Fixed ops | Absorption rate |
| Customer | CSI / retention |
More detailed department dashboards can sit underneath these figures.
The goal is to see problems quickly. For example, falling sales volume combined with rising vehicle age may suggest pricing or demand problems, while strong sales but falling gross PVR may point toward excessive discounting.
FAQs
1. What is the most important KPI for an automotive dealership?
There is no single best KPI. Dealerships should combine vehicle volume, gross profit, inventory turn, fixed absorption, lead conversion, and customer retention to understand overall performance.
2. What is fixed absorption in a dealership?
Fixed absorption measures how much dealership overhead is covered by gross profit from service, parts, and related fixed operations. It is an important indicator of financial resilience.
3. How do dealerships measure inventory performance?
Common measurements include inventory turn, average days in stock, days’ supply, aging buckets, wholesale losses, and gross profit per used vehicle.
4. What is PVR in automotive dealerships?
PVR means per vehicle retailed. It is commonly used for measurements such as F&I gross PVR or total gross profit per retail vehicle.
5. How often should dealership KPIs be reviewed?
Operational metrics such as leads, appointments, sales, and aging inventory can be reviewed daily or weekly. Financial, fixed-operations, expense, and retention trends are often more useful in monthly reviews.
Conclusion
A strong KPI for automotive dealership strategy connects sales, inventory, profitability, fixed operations, digital leads, and customer retention instead of judging the business only by vehicles sold.
Dealership leaders can use benchmarking guidance from NCM Associates, industry-scale service and financial data from the National Automobile Dealers Association, and operational data from their own CRM and dealer-management systems to create realistic targets.
The best dealership dashboard is therefore not the one with the most metrics. It is the one where every KPI for automotive dealership performance has a clear definition, an accountable owner, a review schedule, and an action when the number moves in the wrong direction.
Read more:
